Applies to:
-
Velixo NX
-
Sage Intacct
Overview
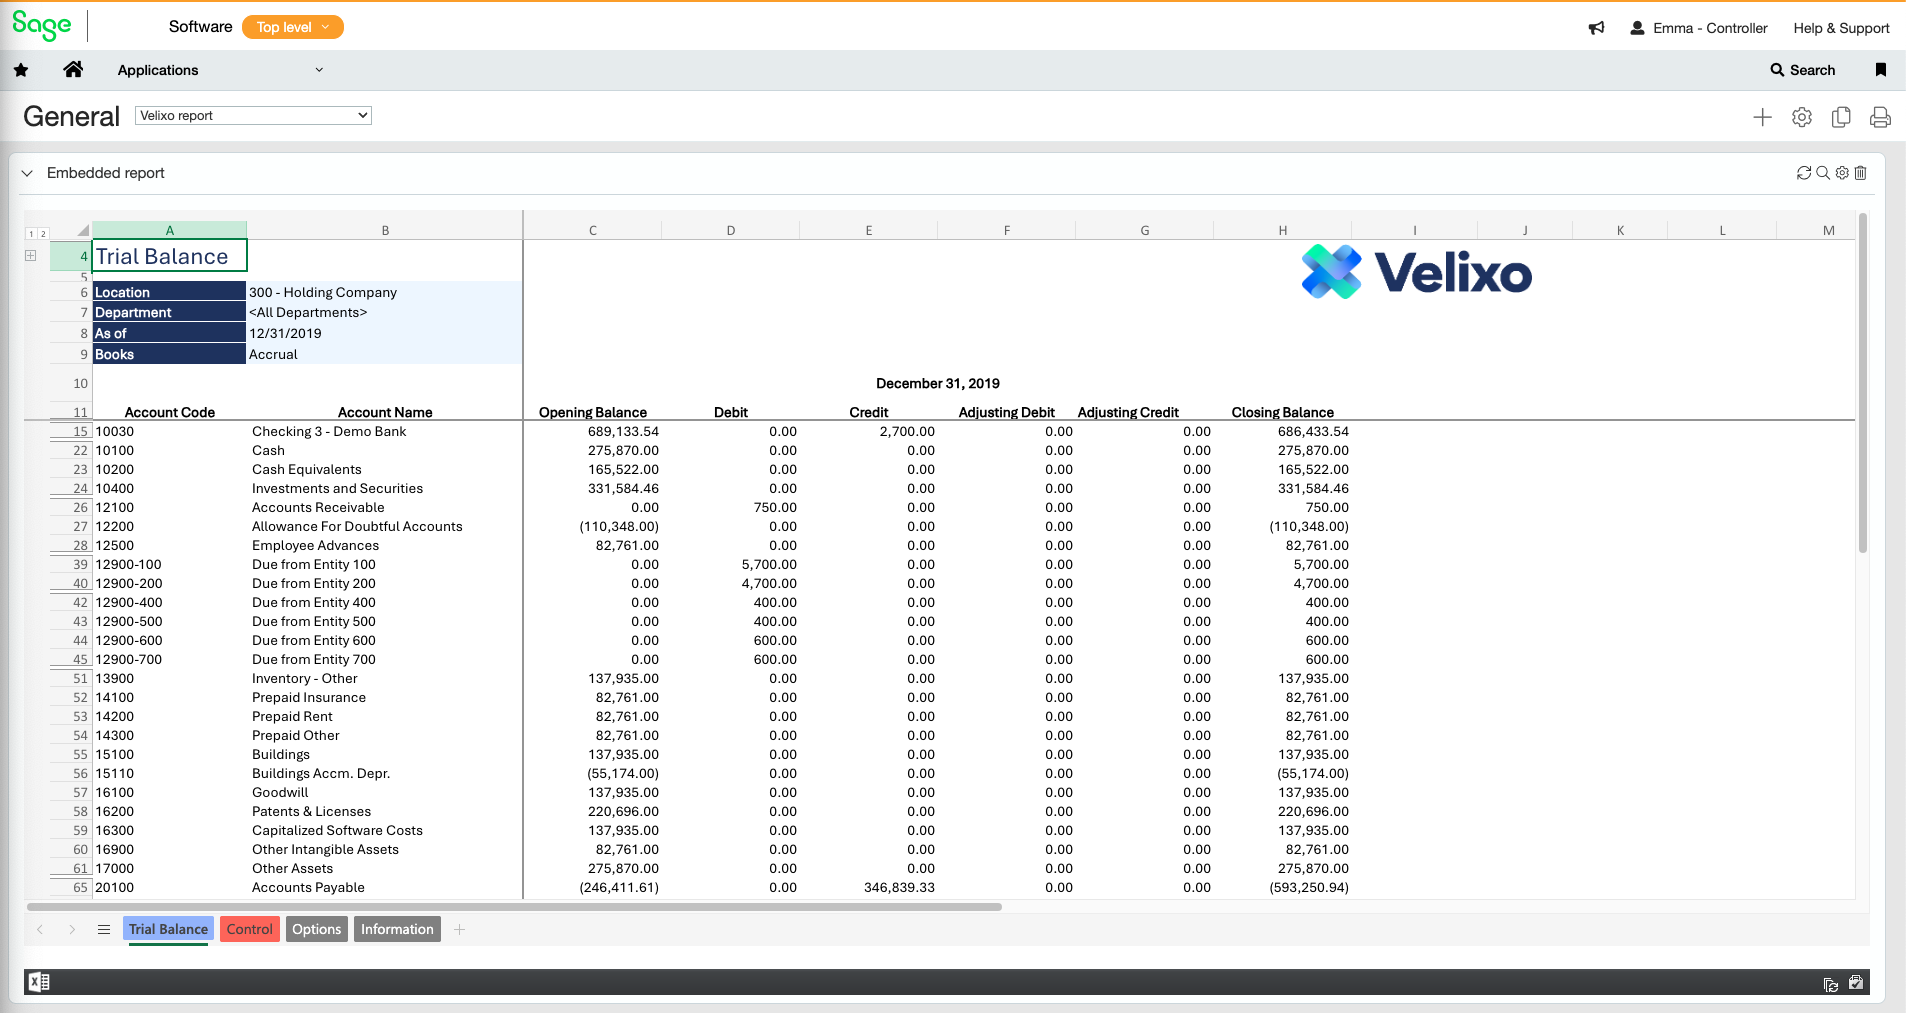
After creating a Velixo report, it can be useful to be able to view the report directly within your ERP Dashboards.
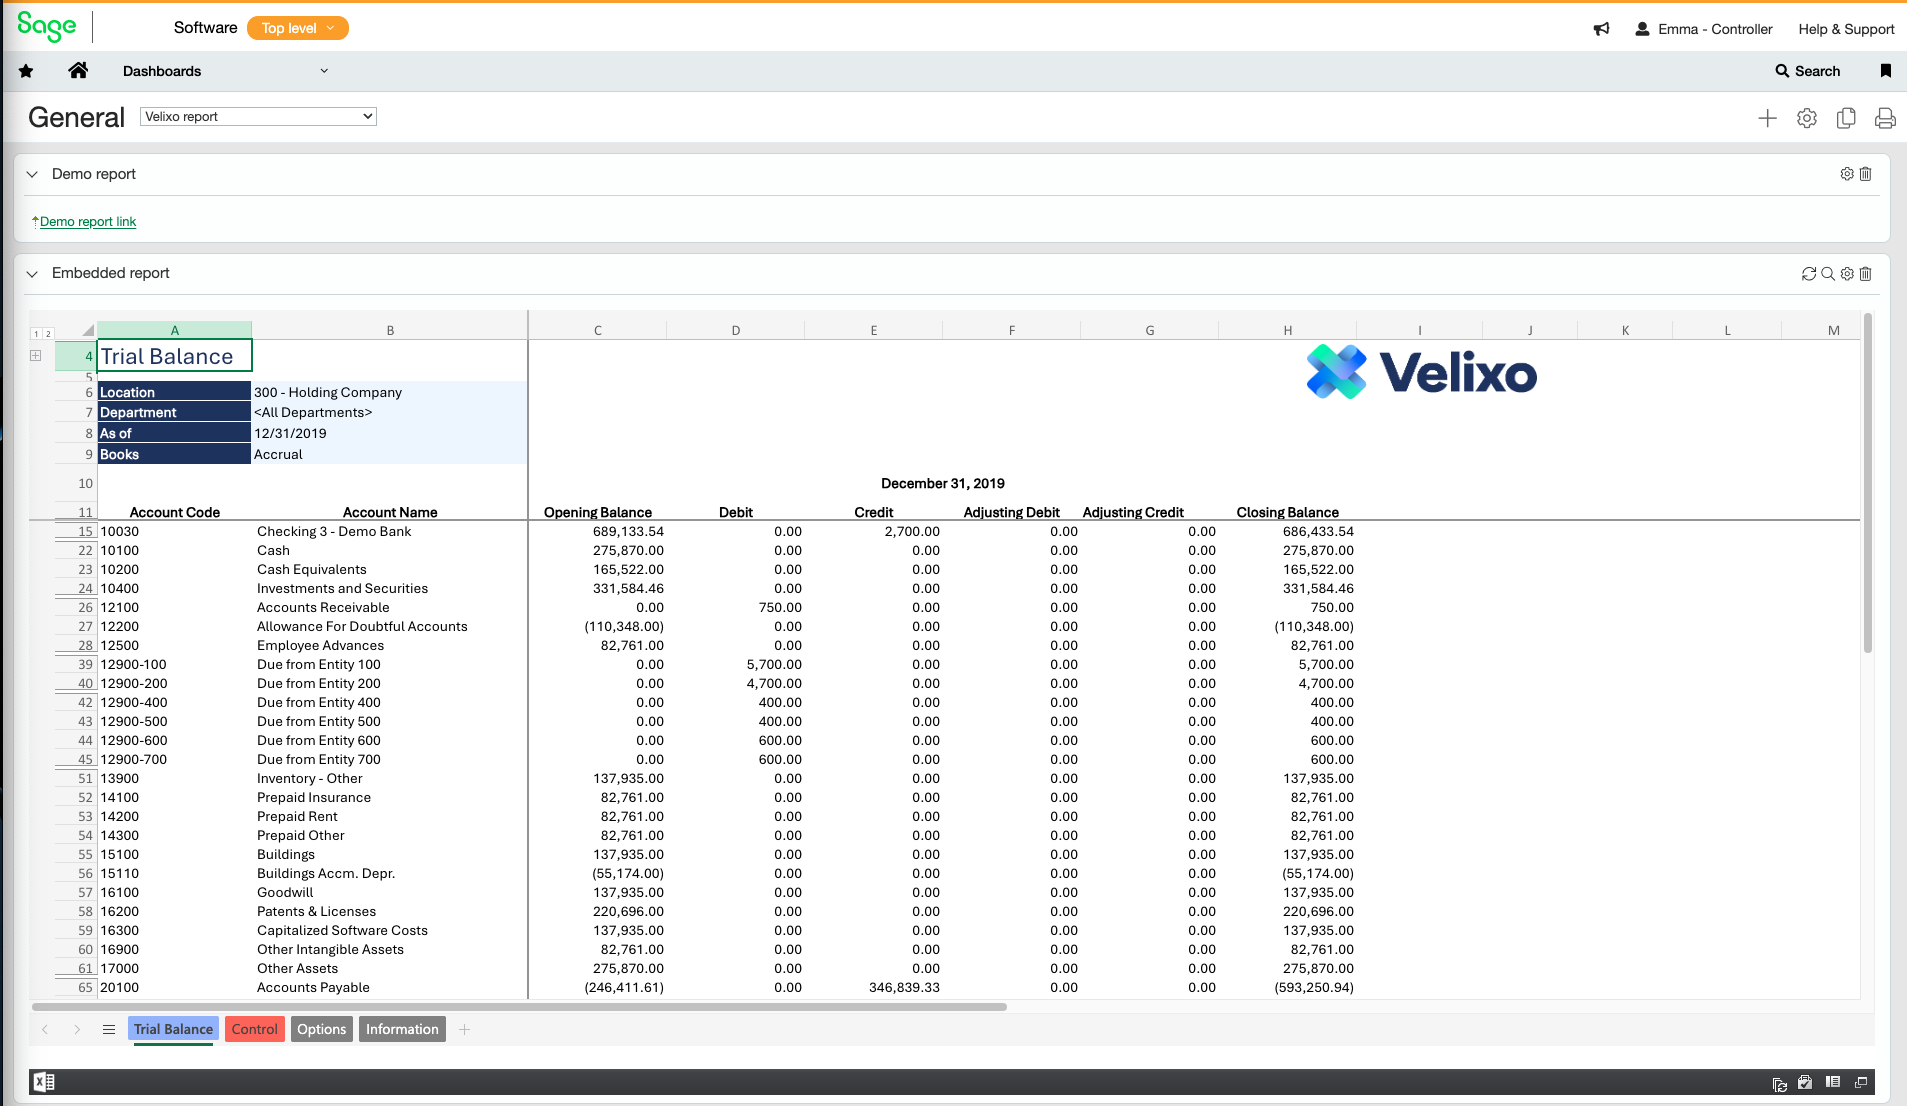
Spreadsheets that are saved to SharePoint/OneDrive can be embedded in a Sage Intacct Dashboard component. Note that they are read-only and cannot be edited or refreshed from the dashboard (this is a limitation within Excel, not your ERP or Velixo). You can add them to a dashboard as an external embedded page.
Embedding a report
Obtain the shared link
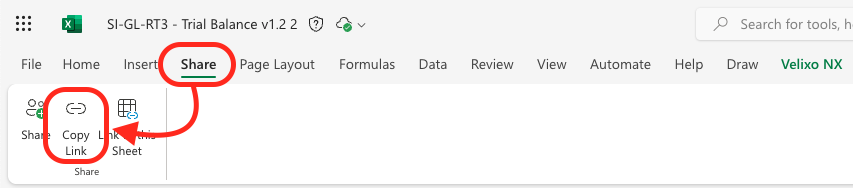
Use Excel Online to open the file you wish to embed in your Sage Intacct Dashboard, go to the Share menu and click the Copy Link button.
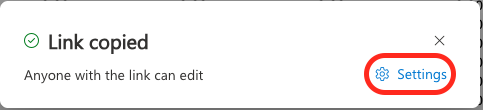
Click Settings in the pop-up window.
In the Link settings pop-up window, select your preferred permissions in the This link works for section, and Can view in the More settings section. Click Apply.
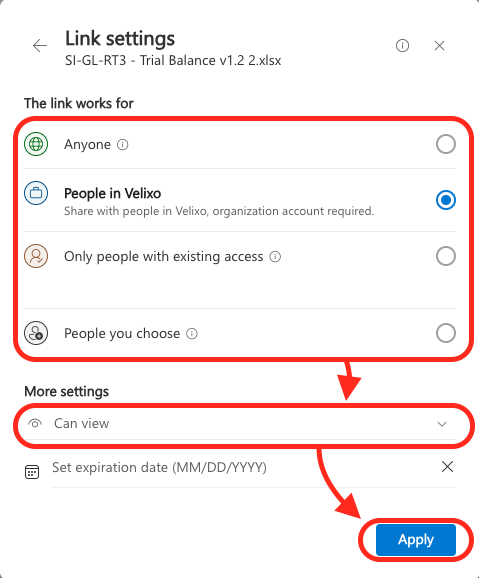
Attention: If you choose to create a public shareable link for your Excel workbook, then if known, it will be accessible by anyone, even people outside your organisation.
To reduce the risk, Velixo recommends restricting access to selected people or people in your organization; or taking extra care not to store, specify or mention the created public link in any internal or external communication. Your IT administrator should only create and copy/paste it during the set-up of a Sage Intacct dashboard.
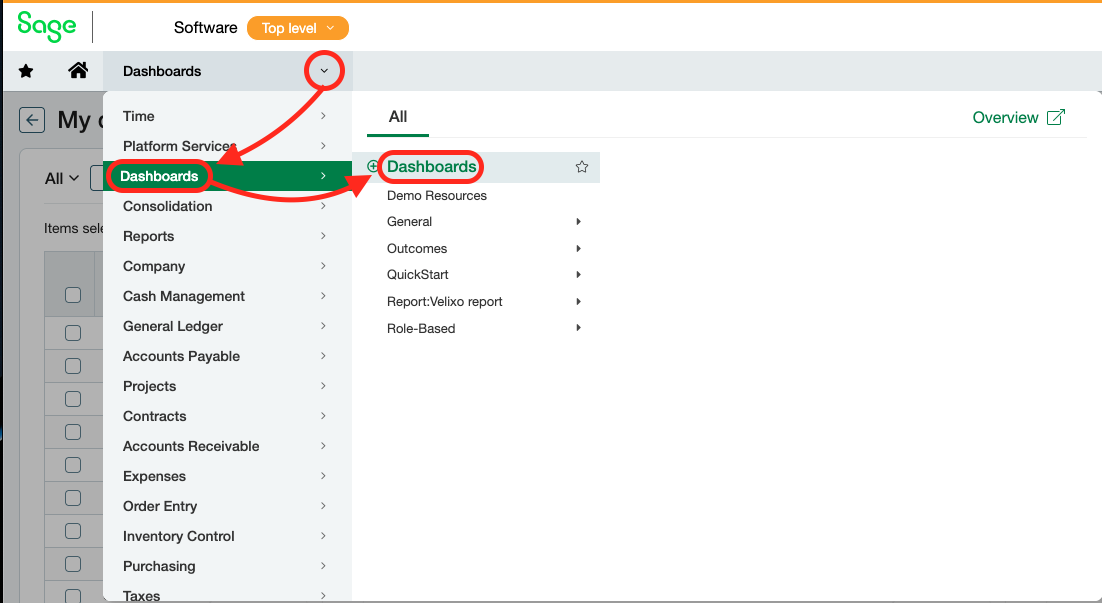
Create or edit a dashboard
In another tab/window, navigate to the Dashboards → Dashboards menu in Sage Intacct.
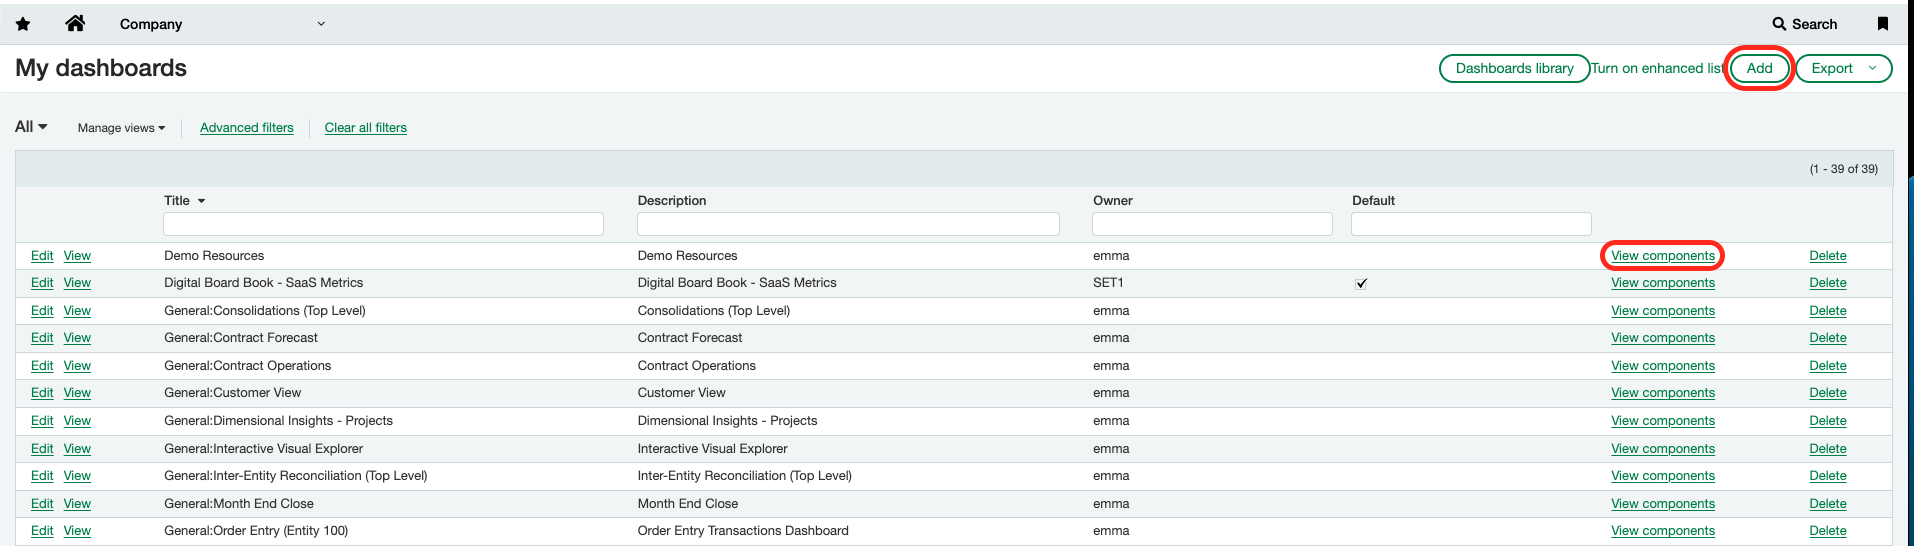
Create a new dashboard by clicking Add, adding a title and selecting Save (optional).
Select the dashboard you wish to use by clicking View components next to the relevant one on the list.
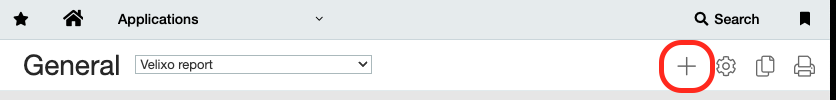
Click the + button to add a new component to your dashboard.
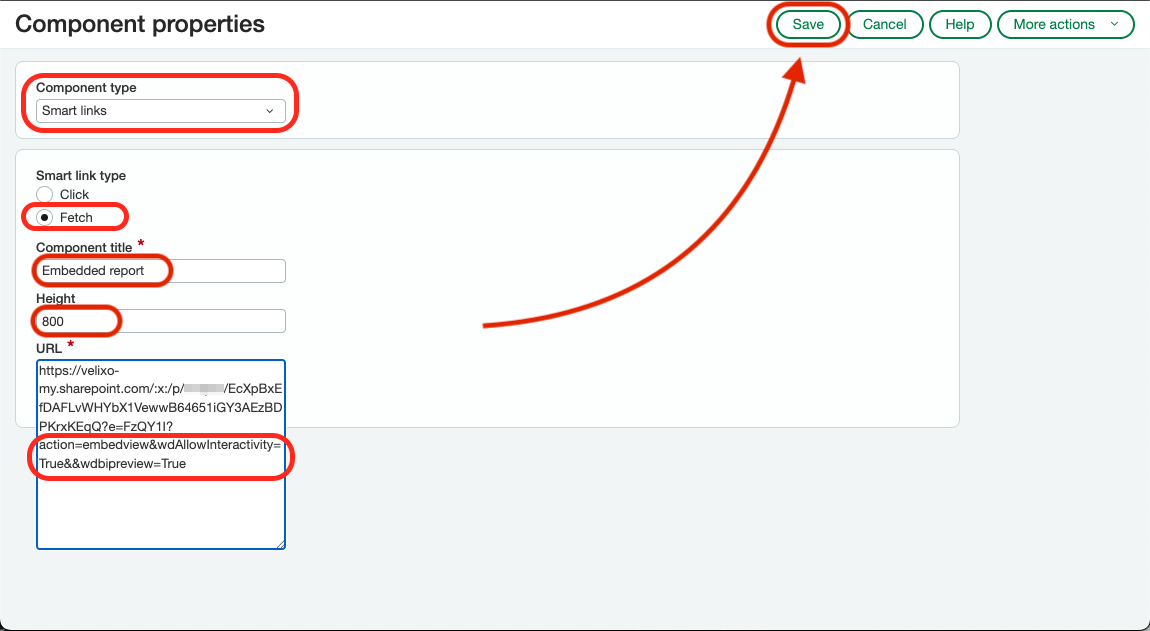
Select Smart links as the component type and set Smart link type to Fetch.
Add a title for your report component and set the Height parameter to 800 (you can later adjust this value if you wish for your component to be shorter or longer).
Paste the URL to your report from Excel Online (to obtain the link, follow the instructions above).
At the end of the URL, add &action=embedview&wdAllowInteractivity=True&&wdbipreview=True to enable embedding the report, the interactive use of filters in Pivot tables, and BI features.
Modified URL example:
https://velixo-my.sharepoint.com/:x:/p/user/EcXpBxEfDAFLvWHYbX1VewwB64651iGY3AEzBDPKrxKEqQ?e=ygsaJk&action=embedview&wdAllowInteractivity=True&&wdbipreview=True
For more information on modifying Excel links, refer to Microsoft’s dedicated support page.
Click Save.
Navigate to the View Components view for your dashboard in the Dashboards menu, and you should see your report embedded.
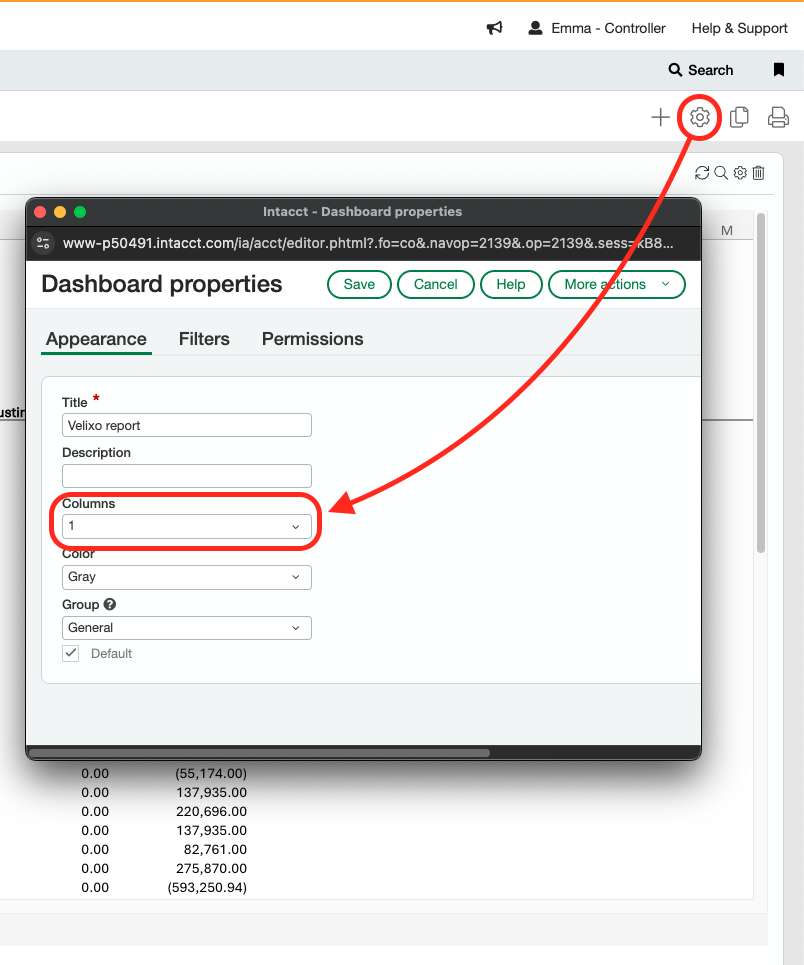
To display the report at the full width of the page, click the Settings icon and set the Columns setting to 1.
To reload the report (for instance after its contents were modified in Excel), use the Refresh button in the top-right corner of your dashboard component.
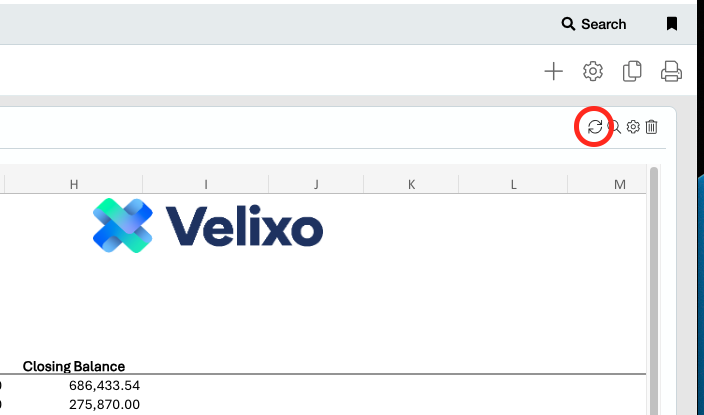
Reloading the embedded report will not Refresh the Excel workbook.