Overview
The SI.XQUERY function provides you with the ability to query the Sage Intacct REST API objects, in a similar way to the SI.QUERY function. The SI.QUERY function, however, queries the older XML API under the hood.
Sage has exposed more objects through their new REST API; for instance, WIP periods and WIP projects, tax entries, and information for local asset management are only accessible through the new REST API via SI.XQUERY.
You may use either SI.QUERY or SI.XQUERY, but bear in mind these two APIs and functions are configured and may behave differently, and only SI.XQUERY would expose new objects developed by Sage.
SI.XQUERY may be used in conjunction with the following functions:
-
SI.XEXPANDOBJECTRANGE allows you to explore objects available for querying
-
SI.XOBJECTDEFINITION provides you with all possible details about the object you are working with, and finally
You can also use Excel aggregation functions (SUM, COUNT, MIN, MAX, and AVERAGE) with the SI.XQUERY function (starting with version 2025.7).
Starting with version 2026.6, SI.XQUERY supports querying custom fields defined in your Sage Intacct environment. You can use custom fields in the Select and Filter arguments and in the Sort setting, and reference them with or without the nsp:: namespace prefix (as returned by SI.XOBJECTDEFINITION) – both forms return the same data.
Syntax
=SI.XQUERY(
    ConnectionName,
    Object,
    Filter,
    Select,
    IncludeHeader,
    Settings,
    OutputColumn1,
    ...
)
Arguments
|
Argument |
Required/Optional |
Description |
|---|---|---|
|
|
Optional |
Provide one of the following values:
OR Omit the argument to return results for all compatible connections with default aggregation settings. |
|
|
Required |
Sage Intacct REST object name. For instance, Please use SI.XEXPANDOBJECTRANGE to explore available objects. |
|
|
Optional |
SQL-like query based on the fields of the object (including custom fields). The following operators are supported: The Joins are not supported. Use the SI.XOBJECTDEFINITION function to get the list of the object fields. You can also use the SI.XQUERYFILTER function to build filters for SI.XQUERY. |
|
|
Optional |
Comma-separated list of columns to be included in the resulting dataset (including custom fields). Reference a field from a related object using dot ( Use SI.XOBJECTDEFINITION for a list of available field names. Supports Sage Intacct aggregation operators: If you omit this argument, all the columns from the object will be returned. Rows where all selected columns have no value are excluded from the results - see Rows with no value in selected columns. |
|
|
Optional |
If |
|
|
Optional |
You can either enter a number (e.g. Two-dimensional array:
Example:
You can use the VX.SETTINGS function to construct the array. |
|
|
Optional |
The address of the header of the first column (top left corner of the Excel table) of the result set. If the argument is omitted, the result is returned as an array. |
|
|
Optional |
The address of the header of the second column of the result set. It must be on the same row as |
|
... |
|
|
|
|
Optional |
The address of the header of the Nth column of the result set. It must be on the same row as |
Output
The function returns a spill range (if OutputColumns are omitted) or an Excel table (if OutputColumns are specified) with the columns specified in the Select argument or all columns if the Select argument is omitted.
You can read about Table mirroring to leverage Excel tables produced by query functions more efficiently.
Excel Online
Loading large datasets with the function is not performant in Excel Online due to the limitations of the Excel platform in the browser. If your dataset contains more than approximately 100,000 records, we strongly recommend using a desktop version of Excel 365 for Windows or Mac OS.
Rows with no value in selected columns
Unlike other Velixo query functions, the function excludes rows where none of the selected columns has a value. When no rows remain after the exclusion, the function returns #N/A with the message "The query returned no results".
The exclusion applies only when all selected columns are empty for a record. For example, selecting id,discountCutOffDate from the accounts-receivable/invoice object returns every invoice and leaves discountCutOffDate blank for invoices without discount terms, while selecting discountCutOffDate alone returns only the invoices that have one. Two formulas that query the same object with a different Select argument can therefore return a different number of rows.
The exclusion does not remove rows when the Select argument is omitted or contains an aggregation. In both cases at least one returned column always has a value: system columns such as id when Select is omitted, and the aggregation itself in grouped results. A group whose grouping column is empty is returned with an empty value in that column.
The spilled range sizes to the number of rows remaining after the exclusion.
Examples
Selected columns, including a related object field
=SI.XQUERY(,"accounts-payable/summary",,"id,entity.href,name,status,totalAmount")
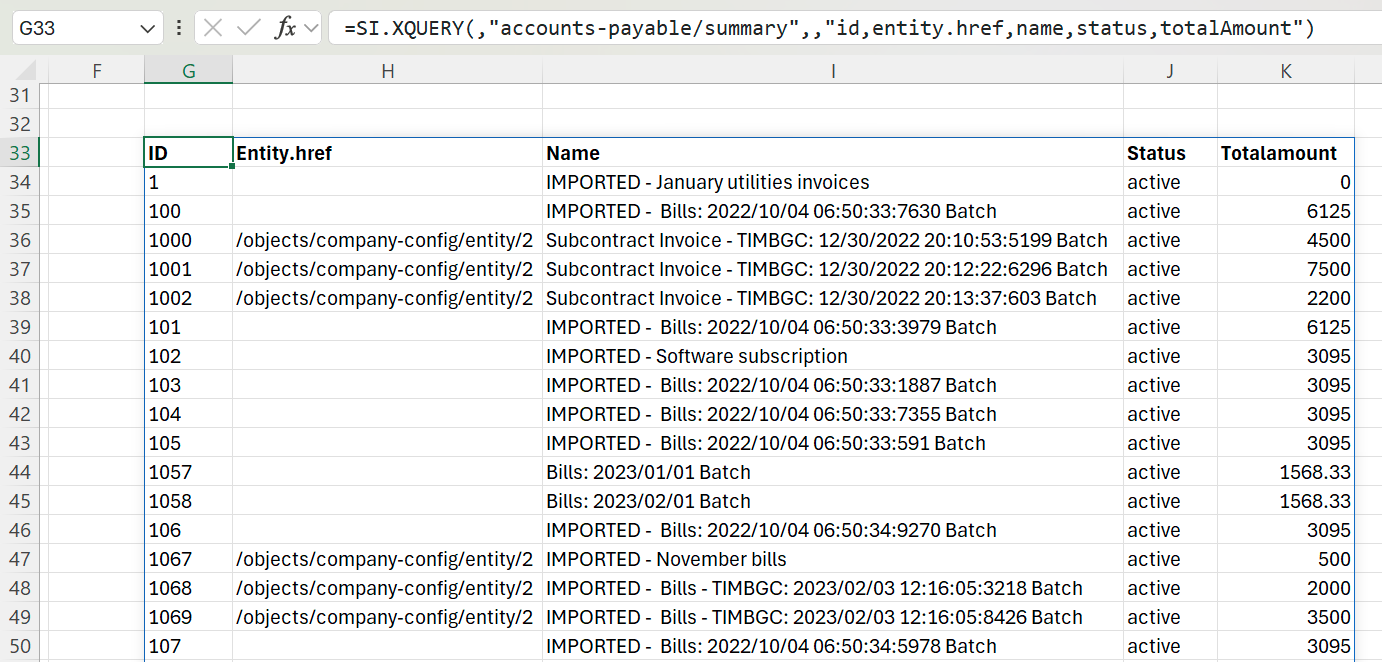
Result: Returns values from the id, name, status, and totalAmount fields from the accounts-payable/summary REST API object, and the field href from the related entity object.
All posted WIP periods ending in 2025 Q1
Say you want to get all posted WIP periods ending in 2025 Q1.
First of all, you need to find the object name.
Use the SI.XEXPANDOBJECTRANGE function to find the name of the WIP period object. It is construction-forecasting/wip-period.
If, for some reason, you have doubts regarding what object to use, please refer to the Sage Intacct documentation.
Then, you might want to look at the object definition to decide what columns you want to see in the query result. Use the SI.XOBJECTDEFINITION function to get all the information.
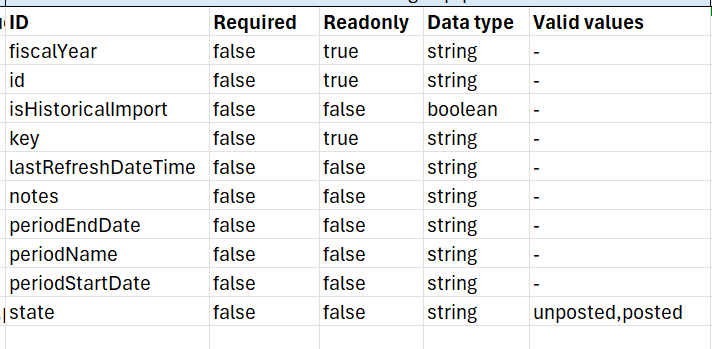
This is the SI.XOBJECTDEFINITION output for construction-forecasting/wip-period.
fiscalYear, id, and isHistoricalImport are the values you can use in the Select, Filter, and Sort arguments, as well as other values in the ID column.
You may select key, periodName, isHistoricalImport, notes, state, and periodEndDate.
The last two will also be used for filtering. The filter will be the following:
periodEndDate >= '2025-01-01' and periodEndDate <= '2025-03-31' and state = 'posted'
Now, the entire query will look this way:
=SI.XQUERY(
    "Sage",
    "construction-forecasting/wip-period",
    "periodEndDate >= '2025-01-01' and periodEndDate <= '2025-03-31' and state = 'posted'",
    "key, periodName, isHistoricalImport, notes, state, periodEndDate"
)
Finally, you can sort your query to make it prettier:
HSTACK({"Sort";"Limit"}, {"periodEndDate:DESC";3})
=SI.XQUERY(
    "Sage",
    "construction-forecasting/wip-period",
    "periodEndDate >= '2025-01-01' and periodEndDate <= '2025-03-31' and state = 'posted'",
    "key, periodName, isHistoricalImport, notes, state, periodEndDate",
    ,
    HSTACK({"Sort";"Limit"}, {"periodEndDate:DESC"; 3})
)
Aggregation examples
Aggregate a single field
=SI.XQUERY(
  "Sage",
  "accounts-payable/summary",
  ,
  "summaryType,SUM(totalAmount)"
)
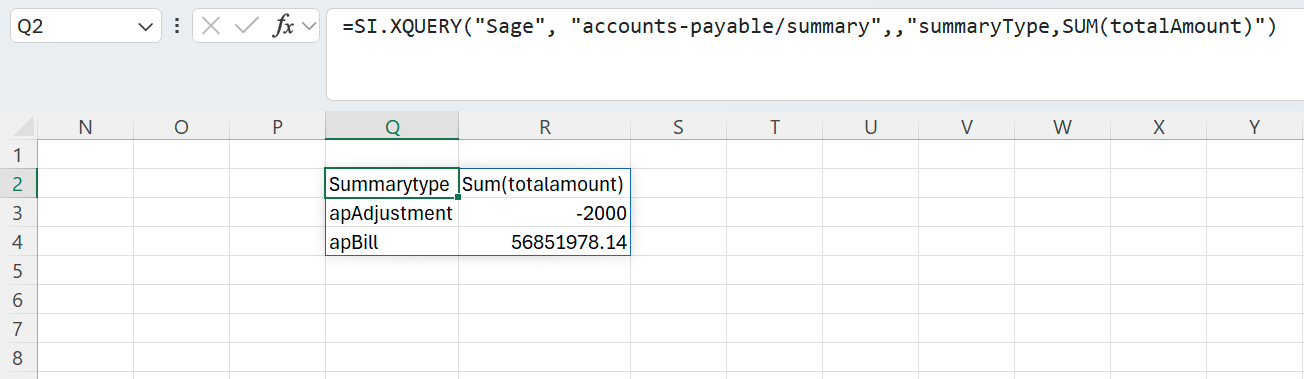
Description
Displays a sum of totalAmount grouped by summaryType in the object ”accounts-payable/summary” for the connection Sage.
Multiple aggregations for a single field
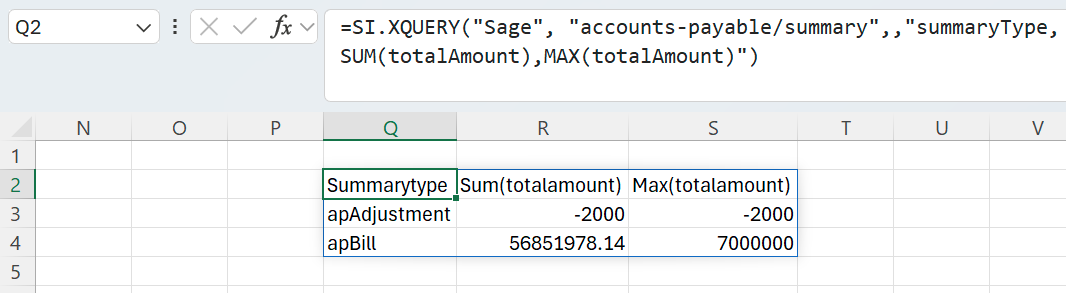
=SI.XQUERY(
  "Sage",
  "accounts-payable/summary",
  ,
  "summaryType,SUM(totalAmount),MAX(totalAmount)"
)
Displays a sum of totalAmount and the highest value for totalAmount grouped by summaryType in the object ”accounts-payable/summary” for the connection Sage.
Aggregations for multiple fields
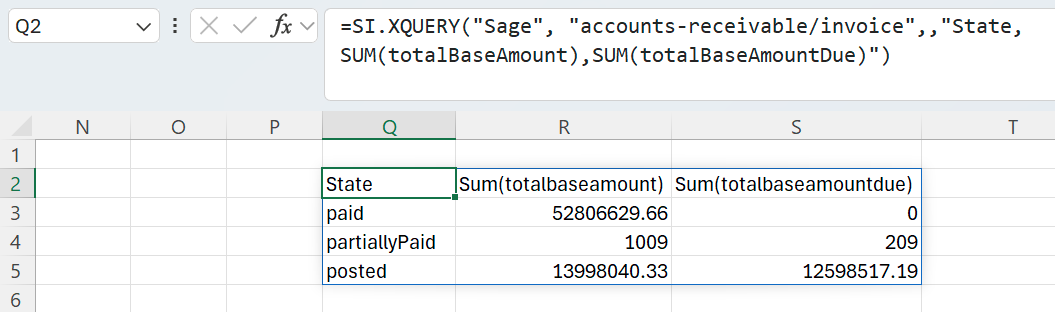
=SI.XQUERY(
  "Sage",
  "accounts-receivable/invoice",
  ,
  "State,SUM(totalBaseAmount),SUM(totalBaseAmountDue)"
)
Displays a sum of both totalBaseAmount and totalBaseAmountDue grouped by State, for the connection Sage.
Aggregation with multiple levels of grouping
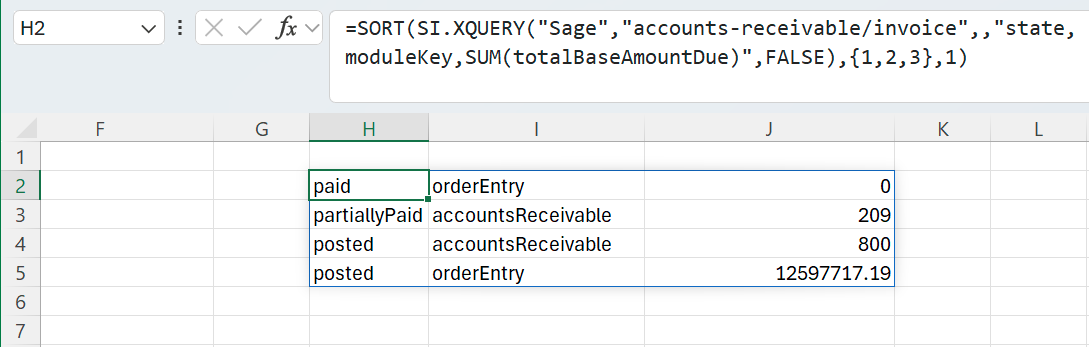
=SORT(
    SI.XQUERY(
      "Sage",
      "accounts-receivable/invoice",
      ,
      "state,moduleKey,SUM(totalBaseAmountDue)",
      FALSE
    ),
    {1,2,3},
    1
)
Displays a sum of totalBaseAmountDue grouped first by state and then by moduleKey. The Excel SORT function is used to combine the grouped aggregations.
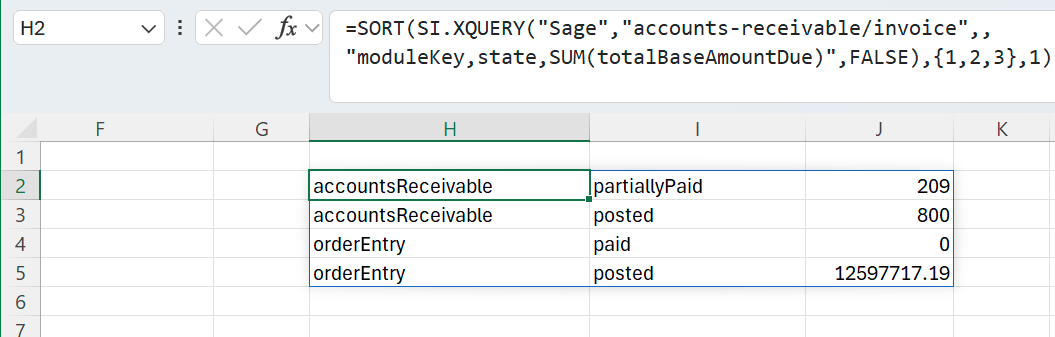
You can change the order of the fields being retrieved in order to change how the data is grouped.
=SORT(
    SI.XQUERY(
      "Sage",
      "accounts-receivable/invoice",
      ,
      "moduleKey,state,SUM(totalBaseAmountDue)",
      FALSE
    ),
    {1,2,3},
    1
)
Displays a sum of totalBaseAmountDue grouped first by moduleKey and then by state.